Cass Transportation Index Report August 2023

Get the most up-to-date data and insights into shipping volumes and the cost of freight. See how they change each month and understand the market forces behind them.

SubscribeDownload Historical Data Points (xls)

The More Things Change

  August 2023 Year-over-year change 2-year stacked change Month-to-month change Month-to-month change (SA*)
Cass Freight Index - Shipments 1.143 -10.6% -7.4% 1.9% 0.8%
Cass Freight Index - Expenditures 3.459 -25.0% -9.7% 1.1% 1.8%
Cass Inferred Freight Rates 3.026 -16.2% NA -0.8% 1.0%
Truckload Linehaul Index 141.3 -11.5% -5.0% -0.5% --


* SA = seasonally adjusted

Cass Freight Index - Shipments

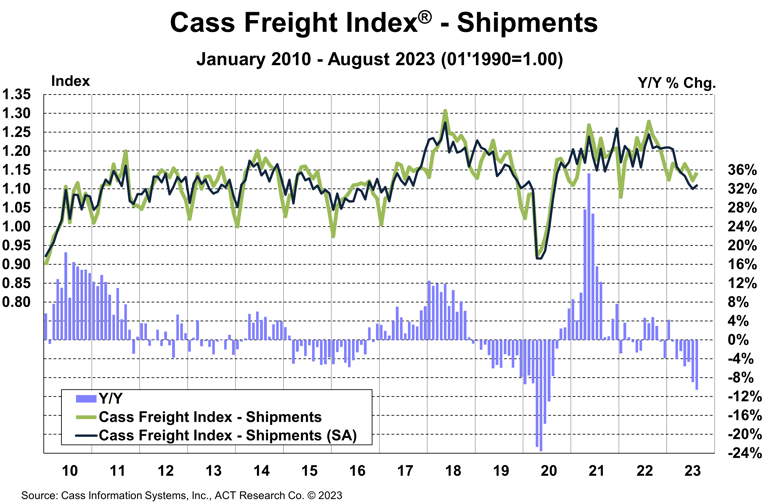
The shipments component of the Cass Freight Index® rose 1.9% m/m in August, or 0.8% m/m seasonally adjusted (SA). 

  • On a y/y basis, the index was 10.6% lower in August, after an 8.9% decline in July.
  • The freight market downcycle is now 20 months old, which compares to a range of 21 to 28 months in the past three downcycles.
  • Part of the large y/y decline is the comparison to the extraordinary time last summer when destocking was creating freight demand as retailers shipped out stale inventory.
  • The current downcycle is similar to the peak-to-trough declines in two of the three downcycles in the past dozen years. The third ended with the pandemic.

The U.S. economy is accelerating, with the Atlanta Fed’s GDPNow tracking at 4.9% q/q GDP growth for Q3, driven by consumption. Though the resumption of student loan payments will likely trim this growth, real retail sales declines are moderating, and destocking seems to be mostly running its course.

With this backdrop, how are for-hire freight volumes declining so much? Private fleet growth is evident as Class 8 tractor retail sales are on pace to set a record this year, yet for-hire fleets are by and large demonstrating capital discipline. Thus, we think a substantial part of the decline in shipments is due to private fleets insourcing freight from the for-hire market.  

With normal seasonality, this index would be flattish m/m in September and decline about 8% y/y, with still extraordinary comparisons, if less so. 


Cass Freight Index Shipments August 2023


See the Methodology for the Cass Freight Index


Cass Freight Index - Expenditures

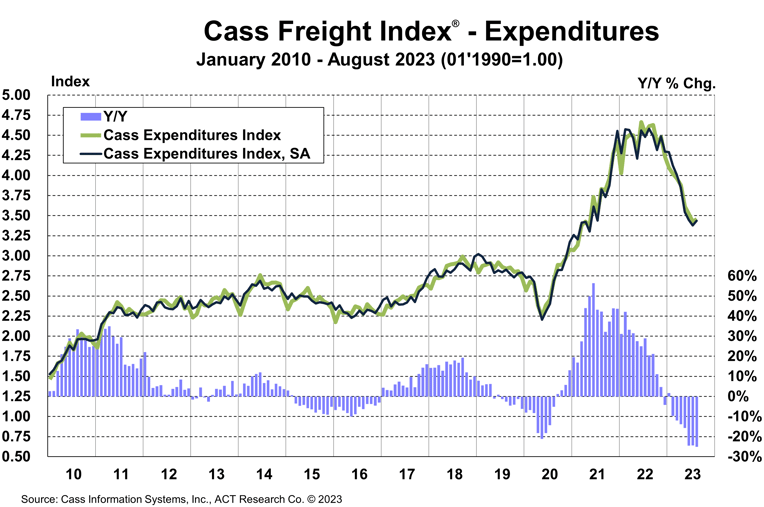
The expenditures component of the Cass Freight Index, which measures the total amount spent on freight, rose 1.1% m/m and fell 25.0% y/y in August.

With shipments up 1.9% m/m in August, we infer rates were down 0.8% m/m (see our inferred rates data series below).

  • On an SA basis, the index rose 1.8% m/m, with shipments up 0.8% and rates up 1.0%.  

This index includes changes in fuel, modal mix, intramodal mix, and accessorial charges, so is a bit more volatile than the cleaner Cass Truckload Linehaul Index®.

The expenditures component of the Cass Freight Index rose 23% in 2022, after a record 38% increase in 2021, but is set to decline about 18% in 2023 and 11% in 1H’24, assuming normal seasonal patterns from here. Both freight volume and rates remain under pressure at this point in the cycle, but fuel price increases could limit the savings for shippers. 

 
Cass Freight Index Expenditures August 2023


Inferred Freight Rates

The rates embedded in the two components of the Cass Freight Index declined 16% y/y in August, after falling 17% in July.

  • Cass Inferred Freight Rates rose 1.0% m/m SA after a 0.8% decline in July. While downward pressure on contract rates is starting to ease, the increase was more likely due to higher fuel surcharges.
  • Based on the normal seasonal pattern, this index would rise m/m in September, but the y/y decline would widen to 18%.
  • We estimate lower fuel prices are knocking about 3% off freight rates y/y. 


Cass Inferred Freight Rates August 2023


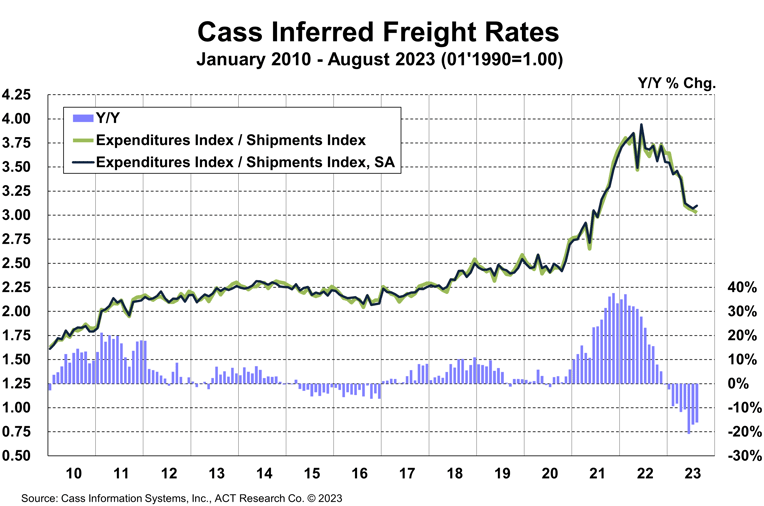
Cass Inferred Freight Rates are a simple calculation of the Cass Freight Index data—expenditures divided by shipments—producing a data set that explains the overall movement in cost per shipment. The data set is diversified among all modes, with truckload (TL) representing more than half of the dollars, followed by less-than-truckload (LTL), rail, parcel, and so on.


Download the Data

Truckload Linehaul Index

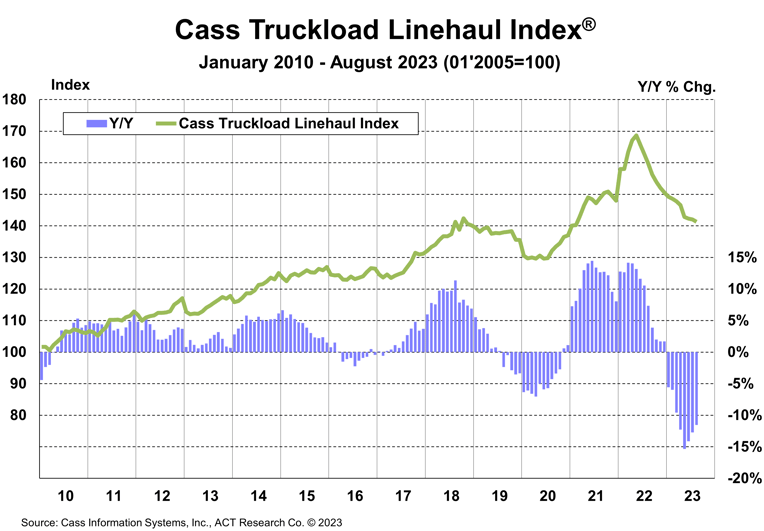
The Cass Truckload Linehaul Index® fell 0.5% m/m in August to 141.3, after a 0.2% m/m decline in July.

  • The slower decline in the past three months, averaging 0.3% m/m, is a markedly slower decline than the 1.4% m/m average m/m decline in the preceding year. This likely reflects a combination of stabilizing spot rates and smaller declines in contract rates. We’ve recently heard anecdotes of fleets addressing unacceptable rates, with some success remediating sharp rate declines. While not likely widespread, this suggests rates are nearing their lows.
  • On a y/y basis, the Cass Truckload Linehaul Index fell 11.5% y/y in August, after a 12.7% y/y decline in July.
  • From here, even modest sequential declines would be accompanied by slowing y/y declines.
  • As a broad truckload market indicator, this index includes both spot and contract freight. With spot rates stabilizing in recent months, the larger contract market is likely to continue adjusting down. 


Cass Truckload Linehaul Index August 2023


See the Methodology for the Cass Truckload Linehaul Index


Freight Expectations

Though significant progress has been made in rebalancing, we think it’s unlikely that industry capacity will broadly tighten until pressure from private fleet growth eases, which seems possible in the next few months.

Though the freight market is still near the bottom of the cycle, the first step in getting out of a hole is to stop digging. In our view, new truck orders in the next few months will be pivotal to setting the market tone for 2024.

The capacity contraction in the for-hire sector is beginning to coil the proverbial spring for better market conditions, but this improving outlook could be spoiled if fleet expansion continues ahead of industry need.

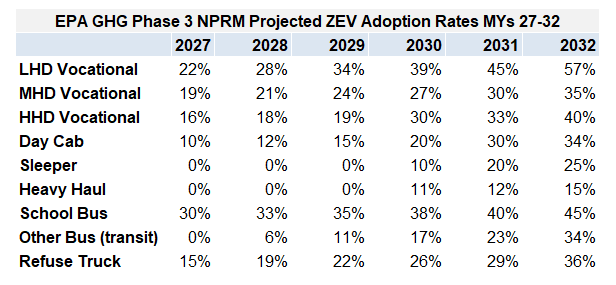
We expect industry financial trends to dictate greater capital discipline next year, but further overexpansion is possible as fleets plan for significant emissions regulations looming in the future.

For example, the Notice of Proposed Rulemaking (NPRM) for the EPA’s upcoming greenhouse gas (GHG) regulation includes the targets for adoption rates of zero-emissions vehicles (ZEVs), as shown in the table below. This could have major implications for industry capacity.


EPA ZEV Adoption Rates 2027-2032


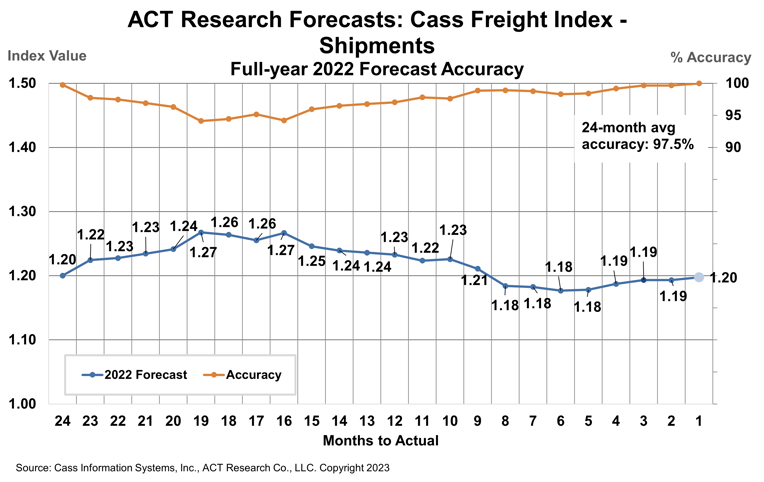
If you need to understand the future direction of freight markets, the ACT Research Freight Forecast provides in-depth analysis and forecasts for a broad range of U.S. freight measures, including the Cass Freight Index, Cass Truckload Linehaul Index, and DAT spot and contract rates by trailer type, LTL and intermodal price indexes. This service provides monthly, quarterly, and annual predictions for the TL, LTL, and intermodal markets over a two- to three-year time horizon, including capacity, volumes, and rates. The Freight Forecast is released monthly in conjunction with this report.

How have their forecasts performed? For 2022, ACT’s forecasts for the shipments component of the Cass Freight Index were 97.5% accurate on average for the 24-month forecast period. Our January 2021 forecast, two full years out, was 99.8% accurate. 

(As a reminder, ACT Research’s Tim Denoyer writes this report.)


ACT Research Forecasts Cass Freight Index2


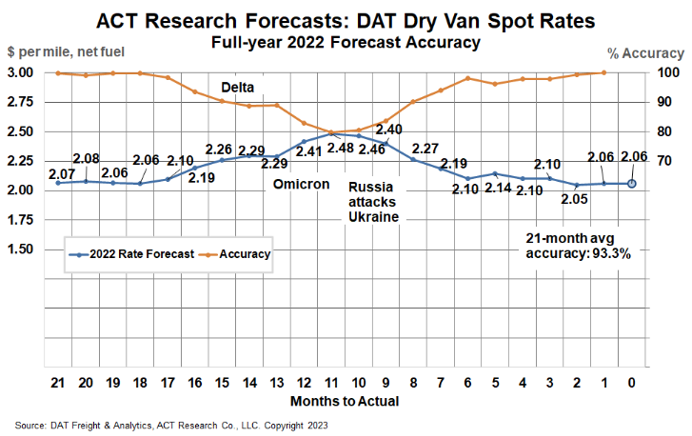
ACT Research’s full-year 2022 DAT spot rate forecasts were 99.7% accurate from Q2’21 (19-21 months out) for dry van and 98.5% for reefer. DAT dry van spot rates, net fuel, finished 2022 at $2.06 per mile, in line with our forecasts to the penny from 18 and 19 months out (June and July 2021). 


ACT Forecast Accuracy DAT Dry Van Spot-x


Release date: We strive to release our indexes on the 13th of each month. When this falls on a Friday or weekend, our goal is to publish on the next business day.

Tim Denoyer head

About the Author: Tim Denoyer, ACT Research

Tim Denoyer joined ACT Research in 2017 after spending fifteen years in equity research focused primarily on the transportation, machinery, and automotive industries. Tim is a senior analyst leading ACT’s transportation research effort and the primary author of the ACT Freight Forecast, U.S. Rate and Volume OUTLOOK. Research associate, Carter Vieth, who joined ACT in early 2020 after graduating from Indiana University, also contributes to the report. This report provides supply-chain professionals with better visibility on the future of pricing and volume in trucking, the core of the $1.2 trillion US freight transportation industry, including TL, LTL, and intermodal. 

Tim also contributes to ACT’s core Classes 4-8 commercial vehicle (CV) data analysis and forecasting; powertrain development, such as electrification analysis; and used truck valuation and forecasting. Tim has supported or led numerous project-based market studies on behalf of clients in his six years with ACT on topics ranging from upcoming emissions and environmental regulations to alternative powertrain cost analyses, to e-commerce and last-mile logistics, to autonomous freight market sizing.  

ACT’s freight research service leverages its expertise in the supply-side economics of transportation and draws upon Tim’s background as an investment analyst, beginning at Prudential and Bear Stearns. Tim was a co-founder of Wolfe Research, one of the leading equity research firms in the investment industry. His experience also includes responsibility for covering the industrial sector of the global equity markets, including with leading investment management company Balyasny Asset Management.

Disclaimer

The material contained herein is intended as general industry commentary. The Cass Freight Index, Cass Truckload Linehaul Index (“Indexes”), and other content are based upon information that we consider reliable, but Cass does not guarantee the accuracy, timeliness, reliability, continued availability or completeness of any information or underlying assumptions, and Cass shall have no liability for any errors, omissions or interruptions. Any data on past performance contained in the Indexes is no guarantee as to future performance. The Indexes and other content are not intended to predict actual results, and no assurances are given with respect thereto. Cass makes no warranty, express or implied. Opinions expressed herein as to the Indexes are those of ACT Research and may differ from those of Cass Information Systems Inc. All opinions and estimates are given as of the date hereof and are subject to change.

Receive Index updates straight to your inbox