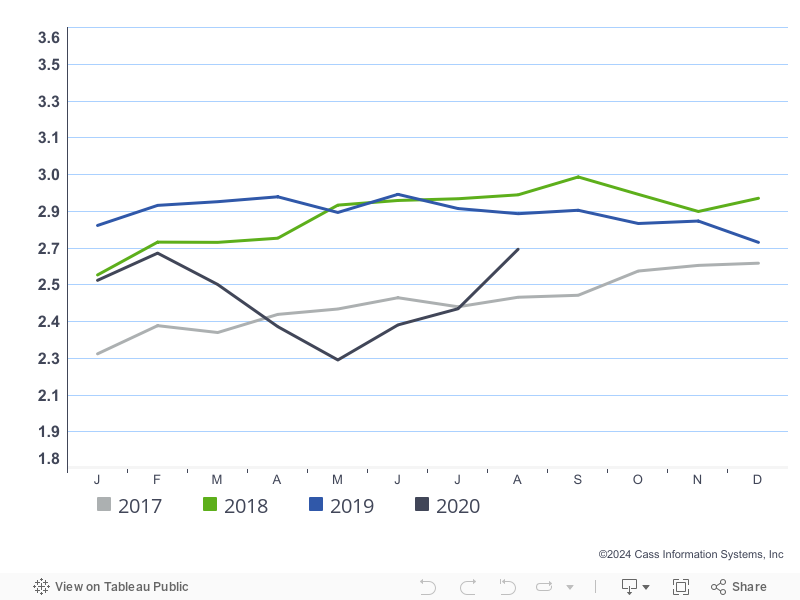
As a measure of economic activity, Cass Freight Index Shipment volumes dropped 13.1% vs year-ago levels (Chart 1), better than last month’s -17.8% y/y change, but still well below where one wants to see it. The raw index reading nudged up 4.8% from June, an acceleration from the 3.5% sequential improvement seen from May to June. And while the shipment index is now 10.3% higher than the April lows, it remains 6.3% below March levels. Given other freight volume indicators (some discussed below), we’d expect the trend to be higher through year-end.
Chart 1 – July shows continued progress off the bottom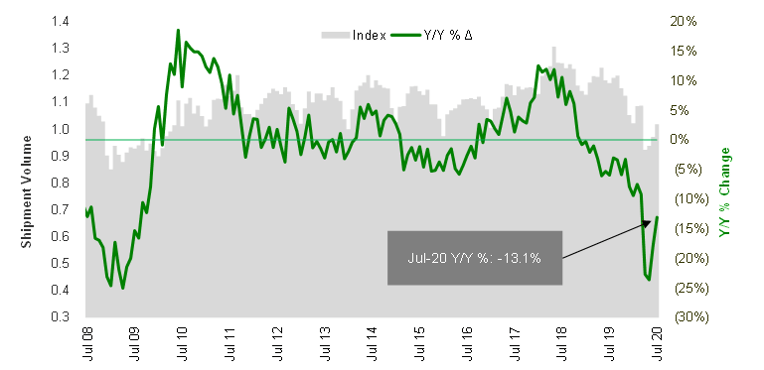
Source: Cass Information Systems, Inc and Stifel research
Chart 2 – Cass Freight Index - shipments are sharply below previous years
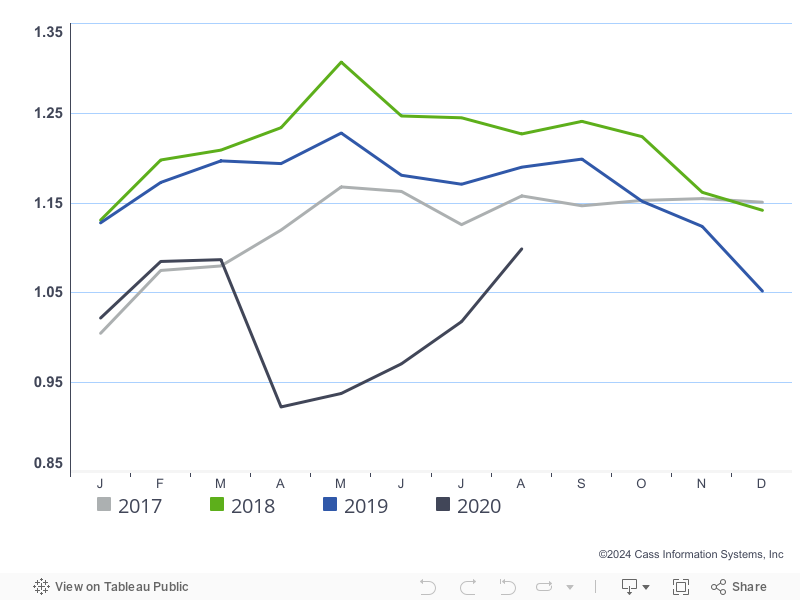
To activate the data download feature, double click within the chart area and then select the download icon.
Click here to receive a monthly alert when new reports are released.
Consumer confidence remains low and (Chart 3) and is likely driving the slow ramp of the Cass Freight Index. The economy is not yet “open” again, and much uncertainty surrounds the sustainability of the government intervention/stimulus. Until we get more confidence back, expect consumer spending to be held in check a bit longer.
Chart 3 – Consumer still on pause
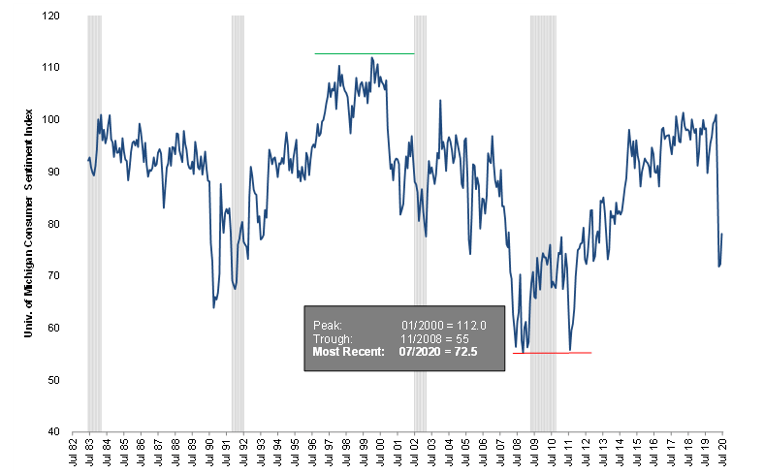
Source: University of Michigan
Imports are back. At least in the West Coast ports, as we saw July container volumes grow again (+5.5% y/y) at the Ports of L.A. and Long Beach (Chart 4). This is not the same at all ports, as inventories at some companies are so lean they’re shifting ocean freight back to the West Coast from a normal all-water route to an East Coast port. Transit time is the biggest concern, so they’re bringing in freight for the Midwest and East via southern California and then moving it by truck and/or intermodal to save time in order to restock.
In the air, international airfreight volumes have been strongest out of Asia (even as PPE demand has moved mostly to ocean), but capacity in all lanes remains the major issue, with most commercial belly capacity staying out of the market—by some estimates—until late 2021. Peak season ahead will be tight, and we expect air cargo yields to be high.
Chart 4 – Imports back on the rise at West Coast ports – will this lead to higher August numbers?
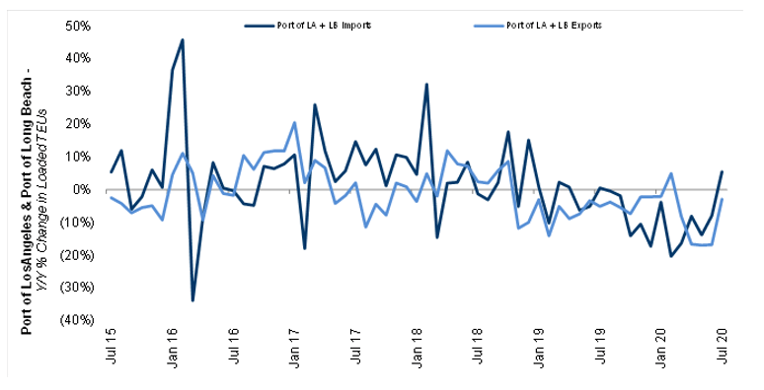
Source: Port of Los Angeles, Port of Long Beach
The weekly rail traffic data (Chart 5) showed further improvements here into August (note: the week 27 comp there was inflated due to an easy July 4th comp, as the holiday was observed on a Friday this year vs a Thursday last year). This data set typically tracks similar to the Cass Freight Index (Chart 6), and while directionally still accurate, the truckload-heavy, more retail Cass volumes are returning more slowly in this recovery. As the rail volume comps continue to improve, we expect it to be favorable for Cass Index trends as well next month.
Chart 5 – U.S. rail traffic shows steady climb in freight volumes
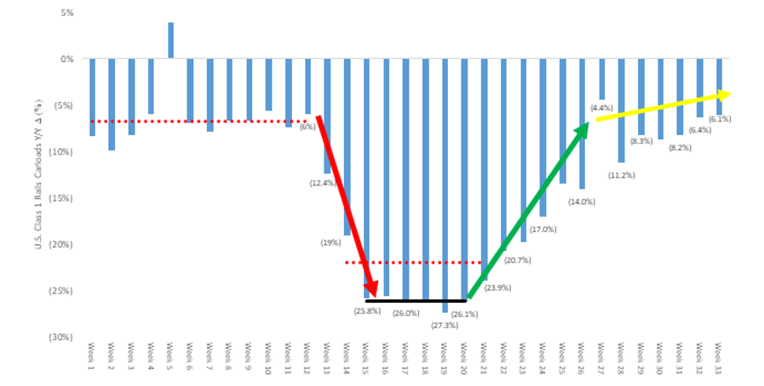
Note – Week 33 carloads are originations through the week of 8/15/2020 for CSX, KSU, NSC, and UNP
Source: Association of American Railroads and Stifel research
Chart 6 – Cass and rail volumes trending in same direction, even if rails moving faster on the rebound
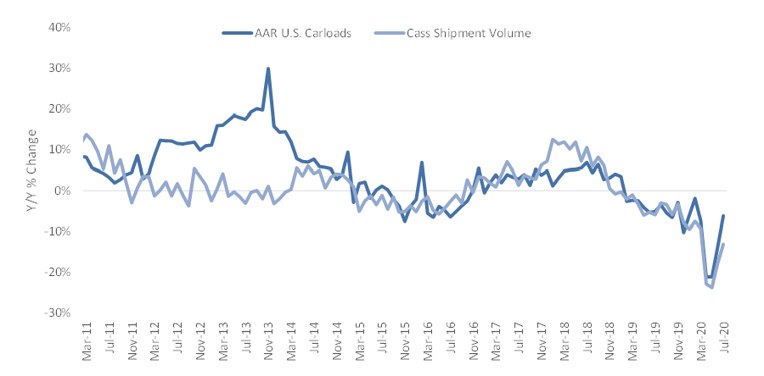
Source: Association of American Railroads, Cass Information Systems, and Stifel estimates
As for shipper spend, freight expenditures were down 14.3% y/y in July (Chart 7) – 9.3% higher than May’s low. It rose 2.8% sequentially from June due to better volumes, but revenue per shipment was softer y/y due to fuel (Chart 9). Mix changes were likely responsible for the sequential decline. With what we’re seeing in the trucking market, hearing from the rails and the parcel carriers, rates will be increasing in the second half of 2020 ahead of the holiday season, so it won’t surprise us if the index improves at a faster rate than volumes the next few months.
Chart 7 – Expenditures also slowly coming back
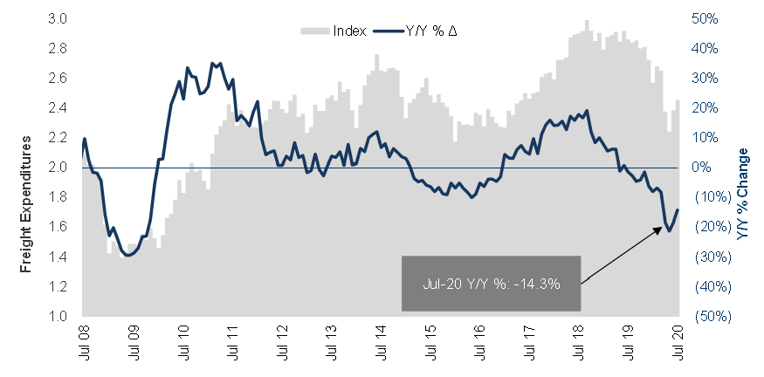
Source: Cass Information Systems, Inc. and Stifel research
Chart 8 – Total spending on freight has taken a hit
To activate the data download feature, double click within the chart area and then select the download icon.
Chart 9 – Diesel prices still ~20% below last year, weighing on dollars/bill (yield)
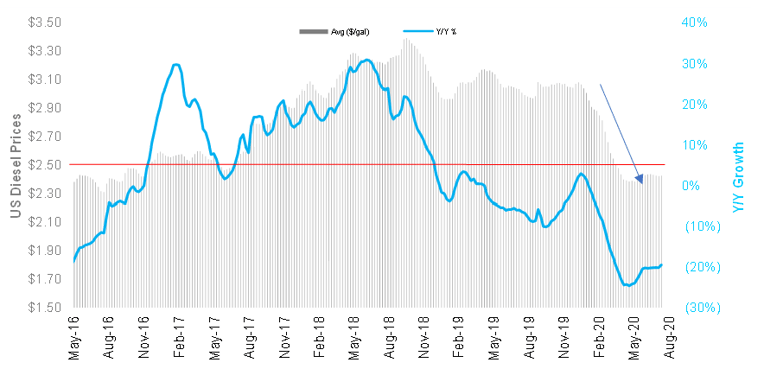
Source: Energy Information Administration
The Truckload Linehaul Index (Chart 10), measuring per-mile linehaul rates, takes a look at the largest (and most fragmented) market in the domestic transportation landscape, and it declined 5.7% y/y in July, barely better than June. The absolute index, which excludes fuel surcharges, was basically flat, but up ever so slightly sequentially from June to July – still in the same range on an absolute level (129-131) we’ve seen since January 2020.
Supply is “only going one way” – so while these rates (mostly contract) are not yet moving higher, we expect this to change by the fourth quarter. For when we look at spot rates (Chart 12) posted in July (and into August here), the pricing picture painted is bullish for upcoming carrier negotiations with shippers. Rates are currently tracking up y/y (including fuel surcharges) in the dry van, flatbed, and reefer markets, with dry van being closest to 2018 peak levels. We believe TL pricing has bottomed and that the rebound in rates, as discussed above, will depend on the strength of the recovery coupled with the pinch of industry supply from factors besides just truck production – like rising insurance costs and limited driver supply.
Chart 10 – Truckload Linehaul Index moves backwards in July
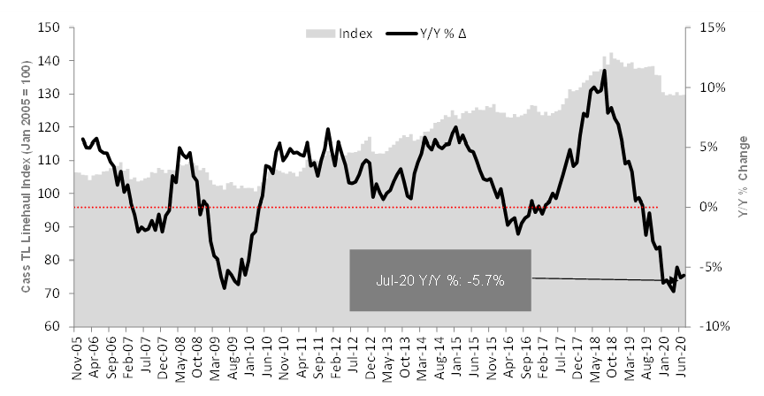
Source: Cass Information Systems, Inc. and Stifel research
Chart 11 – Linehaul rates fluctuating mildly month to month

To activate the data download feature, double click within the chart area and then select the download icon.
Chart 12 – Spot rates for all truckload segments still moving higher due to better demand and less capacity
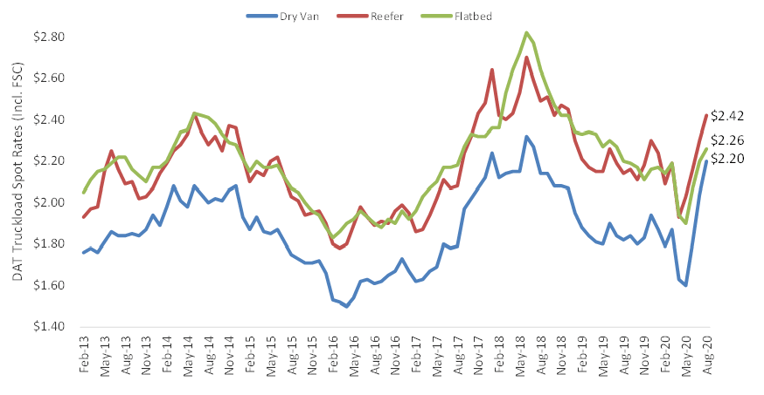
Source: DAT Solutions, through week ended 8/9/20
As we typically note, the Cass Truckload Linehaul Index (Chart 13) has a strong correlation to the quarterly yield metrics reported by the publicly traded TL carriers. And July’s data is showing that TL yields may need another quarter before they really come off the bottom due to contract rate cycles.
Chart 13 – Cass Truckload Linehaul Index not giving great signs about public carrier Q3 yields (yet)
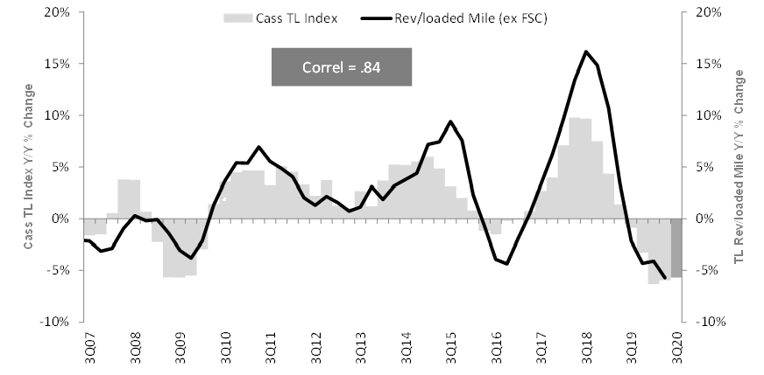
Source: Cass Information Systems, Inc., public carrier data, and Stifel research
The Cass Intermodal Price Index (Chart 14), measuring total per-mile costs, looks at the smaller intermodal market and shows much worse trends than TL, falling 18.3% y/y in July to a new 10-year low. The big difference right now is in the fuel surcharge, as the Cass Truckload Linehaul Index excludes fuel surcharge, whereas the intermodal index includes fuel surcharges. With diesel prices down ~20% y/y, we believe this accounts for roughly 5% of the difference. Intermodal volumes are improving (Chart 16), but after listening to second quarter earnings calls of some of the intermodal carriers, it appears contract pricing was down y/y in 1H20 negotiations, lagging truckload, but that will likely start to turn in the fall.
Chart 14 – Cass Intermodal Price Index off big vs 2019 due to lower fuel and lower contract pricing
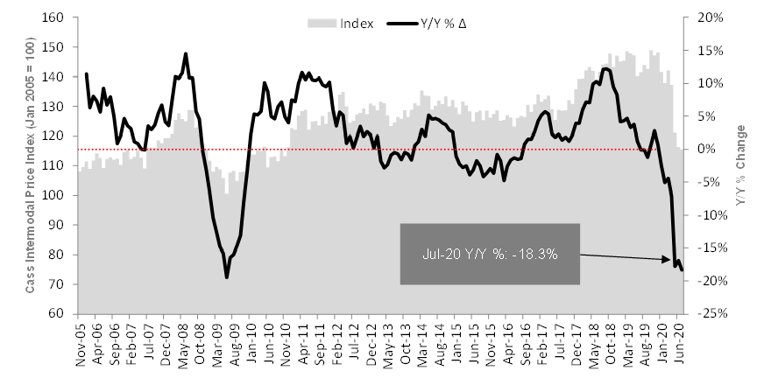
Source: Cass Information Systems, Inc., public carrier data, and Stifel research
Chart 15 – Intermodal costs down more than 18% from last year

To activate the data download feature, double click within the chart area and then select the download icon.
Chart 16 – Intermodal the bright spot for the rails right now, which should mean Cass Intermodal Price Index is about to turn up
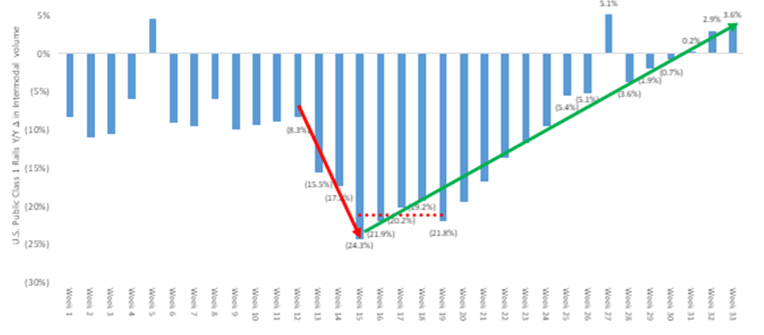
Source: AAR
In summary, the Cass Freight Index showed continued improvement in July, and we will continue to watch for progress in the third quarter. 2019 freight volumes are a good benchmark to work towards. The rail comps may get back to even by the end of the year, but it’s unclear if overall shipment volumes will be able to accomplish this without further government stimulus or another outside boost.