Cass Transportation Index Report September 2023

Get the most up-to-date data and insights into shipping volumes and the cost of freight. See how they change each month and understand the market forces behind them.

SubscribeDownload Historical Data Points (xls)

Some Positive Signs

Freight market likely to deliver savings to shippers this holiday season

  September 2023 Year-over-year change 2-year stacked change Month-to-month change Month-to-month change (SA*)
Cass Freight Index - Shipments 1.163 -6.3% -1.8% 1.7% 1.7%
Cass Freight Index - Expenditures 3.452 -25.4% -9.6% -0.2% -1.6%
Cass Inferred Freight Rates 2.968 -20.4% NA -1.9% -3.3%
Truckload Linehaul Index 142.0 -9.1% -5.6% 0.5% NA


* SA = seasonally adjusted

Cass Freight Index - Shipments

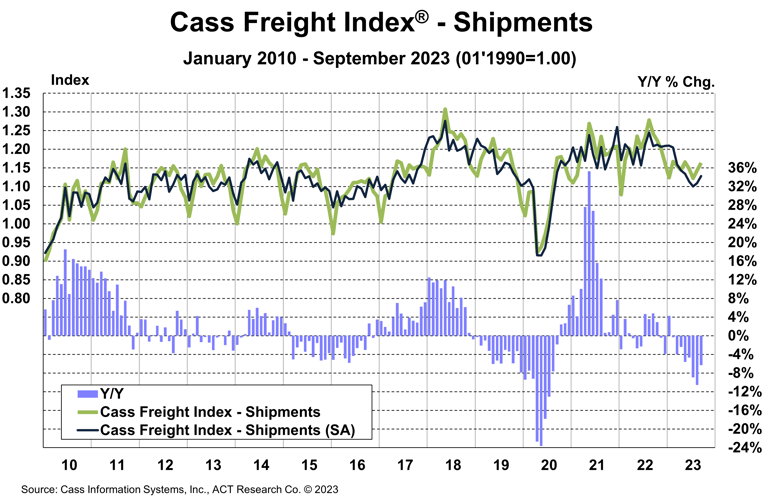
The shipments component of the Cass Freight Index® rose 1.7% m/m in September, following a 1.9% m/m increase in August.

  • On a y/y basis, the index was 6.3% lower in September, after a 10.6% decline in August.
  • U.S. freight volumes, as measured by the Cass Freight Index, have fallen y/y in 14 of the past 21 months, similar to prior downcycles in both length and magnitude, except for the pandemic downturn.
  • The 2023 peak season is off to a muted start with a slightly improving trend, as expected.

We continue to expect modest y/y growth in consumer spending this holiday season, driven by the acceleration in real disposable incomes, and the ongoing strong labor market. 

U.S. real disposable personal income growth slowed from 5.4% y/y in June to 3.7% in August, per the BLS,  as fuel prices surged. The recent violence in the Middle East threatens to send oil prices higher, though they remain down from recent highs. While geopolitical risks are elevated, U.S. consumers will have more in their pockets this holiday season, with good income growth rates supported by disinflation.

With normal seasonality, this index would be down slightly m/m in October and decline about 7% y/y. 


Cass Freight Index Shipments September 2023


See the Methodology for the Cass Freight Index


Cass Freight Index - Expenditures

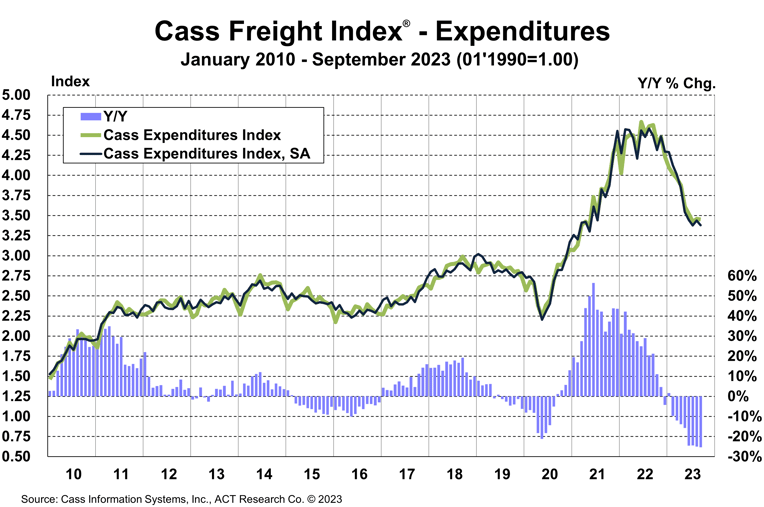
The expenditures component of the Cass Freight Index, which measures the total amount spent on freight, fell 0.2% m/m and 25% y/y in September.

With shipments up 1.7% m/m in September, we infer rates were down 1.8% m/m (see our inferred rates data series below).

  • On an SA (seasonally adjusted) basis, the index fell 1.6% m/m, with shipments up 1.7% and rates down 3.3%.  

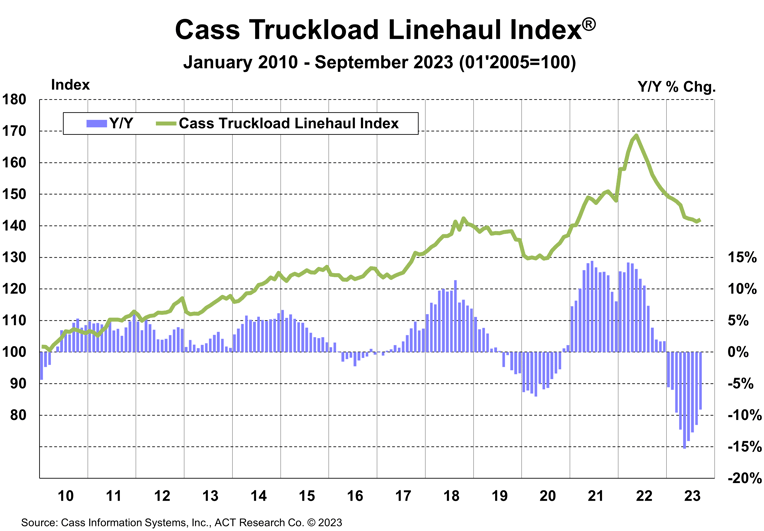
This index includes changes in fuel, modal mix, intramodal mix, and accessorial charges, so is a bit more volatile than the cleaner Cass Truckload Linehaul Index®.

The expenditures component of the Cass Freight Index rose 23% in 2022, after a record 38% increase in 2021, but is set to decline about 18% in 2023 and 11% in 1H’24, assuming normal seasonal patterns from here. Both freight volume and rates remain under pressure at this point in the cycle, but fuel price increases could somewhat limit the savings for shippers. 


Cass Freight Index Expenditures September 2023


Inferred Freight Rates

The rates embedded in the two components of the Cass Freight Index declined 20% y/y in September, after falling 16% in August.

  • Cass Inferred Freight Rates fell 3.3% m/m SA, after a 1.0% increase in August. Market-driven rate declines have averaged 1.2% per month for the past 18 months.
  • Based on the normal seasonal pattern, this index would rise m/m in October, and the y/y decline would narrow to 16%.
  • With spot rates stabilizing, sequential declines are likely to slow from here, but the freight market is likely to deliver more savings to shippers this holiday season.


Cass Inferred Rates Index September 2023


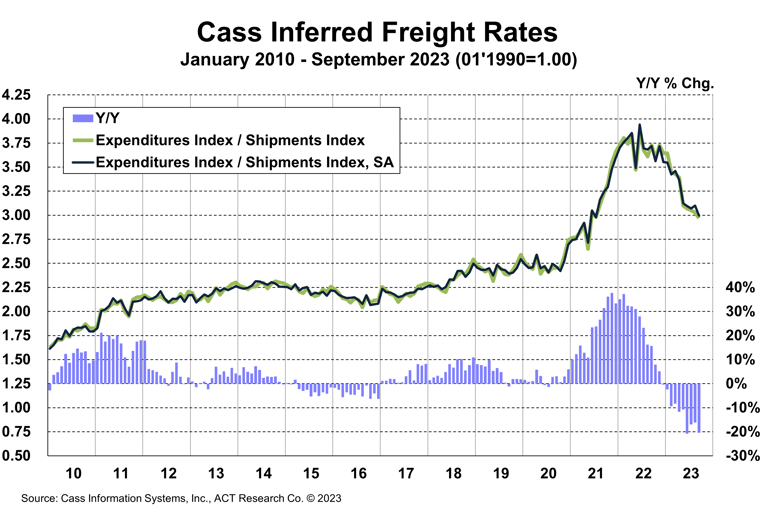
Cass Inferred Freight Rates are a simple calculation of the Cass Freight Index data—expenditures divided by shipments—producing a data set that explains the overall movement in cost per shipment. The data set is diversified among all modes, with truckload (TL) representing more than half of the dollars, followed by less-than-truckload (LTL), rail, parcel, and so on.


Download the Data

Truckload Linehaul Index

The Cass Truckload Linehaul Index rose 0.5% m/m in September to 142.0, after a 0.5% m/m decline in August.

  • The small increase is more likely a pause than a trend change, but reinforces some anecdotes (also noted in this report last month) of fleets addressing accepted but unacceptable rates. While not likely widespread, this suggests rates are nearing their lows. Are TL rates nearing a bottom?
  • On a y/y basis, the Cass Truckload Linehaul Index fell 9.1% y/y in September, after an 11.5% y/y decline in August.
  • From here, even modest sequential declines would be accompanied by slowing y/y declines.
  • As a broad truckload market indicator, this index includes both spot and contract freight. With spot rates stabilizing in recent 


Cass Truckload Linehaul Index September 2023


See the Methodology for the Cass Truckload Linehaul Index


Freight Expectations

Wise people say failures are signposts on the road to success. As we look at the record this year of forecasting the economics, finance, and freight markets, we see many of those signposts.

With the U.S. recession consensus of the first half of 2023 giving way to robust growth, and expectations for an improved freight cycle scuttled by private fleet growth, we’re still left in a fairly strong economy.

With both the shipments component of the Cass Freight Index and the Cass Truckload Linehaul Index rising sequentially this month, the freight cycle is at least starting to flatten out, with smaller y/y declines. We continue to expect the freight cycle to turn once capacity tightens, but early signs of 2024 equipment production suggest that may be a while. 

If you need to understand the future direction of freight markets, the ACT Research Freight Forecast provides in-depth analysis and forecasts for a broad range of U.S. freight measures, including the Cass Freight Index, Cass Truckload Linehaul Index, and DAT spot and contract rates by trailer type, LTL and intermodal price indexes. This service provides monthly, quarterly, and annual predictions for the TL, LTL, and intermodal markets over a two- to three-year time horizon, including capacity, volumes, and rates. The Freight Forecast is released monthly in conjunction with this report.

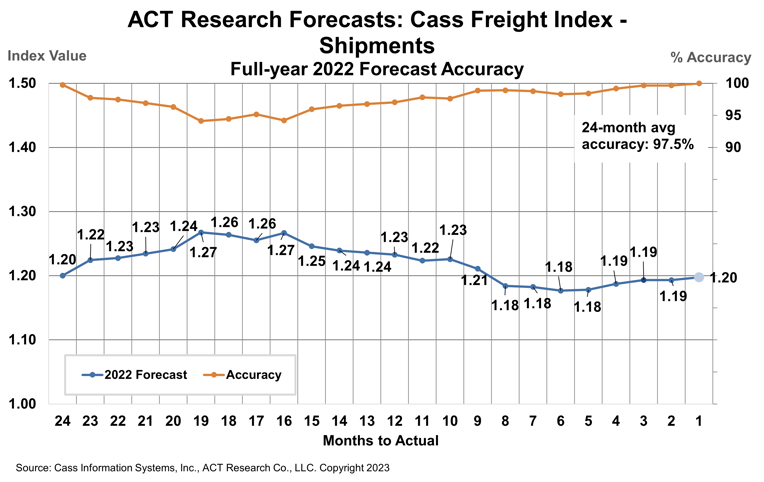
How have their forecasts performed? For 2022, ACT’s forecasts for the shipments component of the Cass Freight Index were 97.5% accurate on average for the 24-month forecast period. Our January 2021 forecast, two full years out, was 99.8% accurate. 

(As a reminder, ACT Research’s Tim Denoyer writes this report.)


ACT Research Forecasts Cass Freight Index2


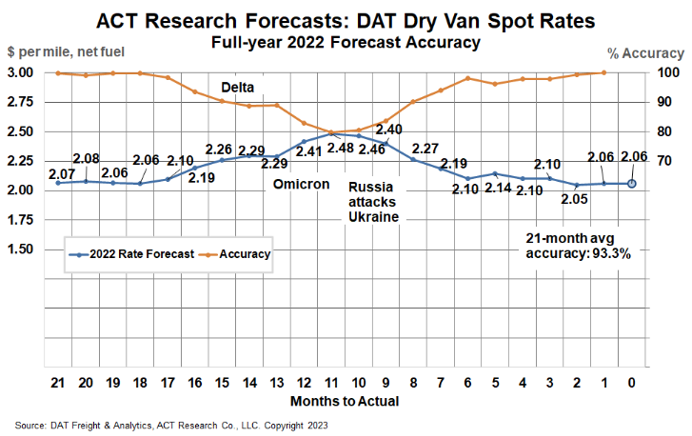
ACT Research’s full-year 2022 DAT spot rate forecasts were 99.7% accurate from Q2’21 (19-21 months out) for dry van and 98.5% for reefer. DAT dry van spot rates, net fuel, finished 2022 at $2.06 per mile, in line with our forecasts to the penny from 18 and 19 months out (June and July 2021). 


ACT Forecast Accuracy DAT Dry Van Spot-x


Release date: We strive to release our indexes on the 13th of each month. When this falls on a Friday or weekend, our goal is to publish on the next business day.

Tim Denoyer head

About the Author: Tim Denoyer, ACT Research

Tim Denoyer joined ACT Research in 2017 after spending fifteen years in equity research focused primarily on the transportation, machinery, and automotive industries. Tim is a senior analyst leading ACT’s transportation research effort and the primary author of the ACT Freight Forecast, U.S. Rate and Volume OUTLOOK. Research associate, Carter Vieth, who joined ACT in early 2020 after graduating from Indiana University, also contributes to the report. This report provides supply-chain professionals with better visibility on the future of pricing and volume in trucking, the core of the $1.2 trillion US freight transportation industry, including TL, LTL, and intermodal. 

Tim also contributes to ACT’s core Classes 4-8 commercial vehicle (CV) data analysis and forecasting; powertrain development, such as electrification analysis; and used truck valuation and forecasting. Tim has supported or led numerous project-based market studies on behalf of clients in his six years with ACT on topics ranging from upcoming emissions and environmental regulations to alternative powertrain cost analyses, to e-commerce and last-mile logistics, to autonomous freight market sizing.  

ACT’s freight research service leverages its expertise in the supply-side economics of transportation and draws upon Tim’s background as an investment analyst, beginning at Prudential and Bear Stearns. Tim was a co-founder of Wolfe Research, one of the leading equity research firms in the investment industry. His experience also includes responsibility for covering the industrial sector of the global equity markets, including with leading investment management company Balyasny Asset Management.

Disclaimer

The material contained herein is intended as general industry commentary. The Cass Freight Index, Cass Truckload Linehaul Index (“Indexes”), and other content are based upon information that we consider reliable, but Cass does not guarantee the accuracy, timeliness, reliability, continued availability or completeness of any information or underlying assumptions, and Cass shall have no liability for any errors, omissions or interruptions. Any data on past performance contained in the Indexes is no guarantee as to future performance. The Indexes and other content are not intended to predict actual results, and no assurances are given with respect thereto. Cass makes no warranty, express or implied. Opinions expressed herein as to the Indexes are those of ACT Research and may differ from those of Cass Information Systems Inc. All opinions and estimates are given as of the date hereof and are subject to change.

Receive Index updates straight to your inbox