The shipments component of the Cass Freight Index® fell 1.3% m/m in April, as for-hire demand remains broadly soft. The index fell 1.6% m/m in seasonally adjusted (SA) terms, returning volumes to the cycle lows of 2H’23.
The GDP-based ACT Freight Composite, which measures the freight economy in real GDP terms, started to show y/y increases in 2H’23, similar to imports and intermodal volumes. For-hire fleets likely still are seeing soft demand because of significant private fleet capacity additions in the past couple of years. Private fleets are now more actively competing for spot freight to fill empty backhauls, lengthening below-trend for-hire demand levels.
After rising 0.6% in 2022, the Cass shipments index declined 5.5% in 2023. With normal seasonality, the index will fall about 3% y/y in May.

See the Methodology for the Cass Freight Index
The expenditures component of the Cass Freight Index, which measures the total amount spent on freight, was unchanged in April, and down 17% y/y.
With shipments down 1.3% m/m, we infer rates were up 1.4% m/m in April (see our inferred rates data series below).
This index includes changes in fuel, modal mix, intramodal mix, and accessorial charges, so is a bit more volatile than the cleaner Cass Truckload Linehaul Index®.
The expenditures component of the Cass Freight Index fell 19% in 2023, after a record 38% surge in 2021 and another 23% increase in 2022. It is set to decline about another 16% in 1H’24, assuming normal seasonal patterns from here, and 10% for the full year.

The rates embedded in the two components of the Cass Freight Index—reflecting the average cost of freight—declined 13% y/y in April, the narrowest decline in eleven months.
The normal seasonal pattern from here would leave inferred rates down 8% in 2024. Even if rates begin moving higher, as is eventually likely, freight will very likely remain deflationary this year.

Cass Inferred Freight Rates are a simple calculation of the Cass Freight Index data—expenditures divided by shipments—producing a data set that explains the overall movement in cost per shipment. The data set is diversified among all modes, with truckload (TL) representing more than half of the dollars, followed by less-than-truckload (LTL), rail, parcel, and so on.
The Cass Truckload Linehaul Index® managed to rise slightly, 0.1%, in April, marking the third straight slight increase. The y/y decline continued to gradually narrow to 3.8%.
This index has been in a very tight range, from 140.4 to 142.0, over the past ten months as the market finds a floor.
As a broad truckload market indicator, this index includes both spot and contract freight. With spot rates steady over the past several months, downward pressure on the larger contract market is lessening, with some instances of contract rate increases bucking the downtrend recently.

See the Methodology for the Cass Truckload Linehaul Index
One positive conclusion we can draw is that any concerns about recent supply chain disruptions impacting inflation are unfounded. It appears logistics will continue to contribute to disinflation for a while.
Some pockets of tightness are appearing in reefer and flatbed markets, but as we write ahead of Roadcheck, the truckload market is still well-supplied, with private fleets increasingly competing for spot loads recently. Goldilocks economic conditions of strong growth and disinflation are largely holding, a rising tide which eventually should lift all boats. But at the moment, the freight growth being generated by the economy is being handled by railroads and private fleets.
To the extent private fleets are successful filling backhauls, it will further delay the for-hire cycle. The good news is that they’re not nearly as cost effective as for-hire fleets, so it will turn eventually.
Our outlook through 2026 is detailed in the ACT Research Freight Forecast. This service provides in-depth analysis and forecasts for a broad range of U.S. freight measures, including the Cass Freight Index, Cass Truckload Linehaul Index, and DAT spot and contract rates by trailer type, LTL, and intermodal price indexes. ACT Research provides monthly, quarterly, and annual predictions for over 40 data series over a two- to three-year time horizon, including capacity, volumes, and rates. The Freight Forecast is released monthly in conjunction with the Cass Transportation Index report.
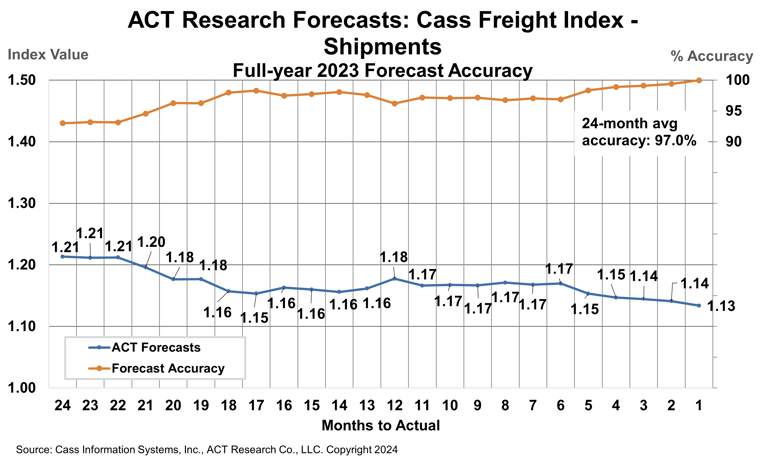
How have ACT Research’s freight forecasts performed? For 2023, ACT’s forecasts for the shipments component of the Cass Freight Index were 96.9% accurate on average for the 24-month forecast period.
(As a reminder, ACT Research’s Tim Denoyer writes this report.)
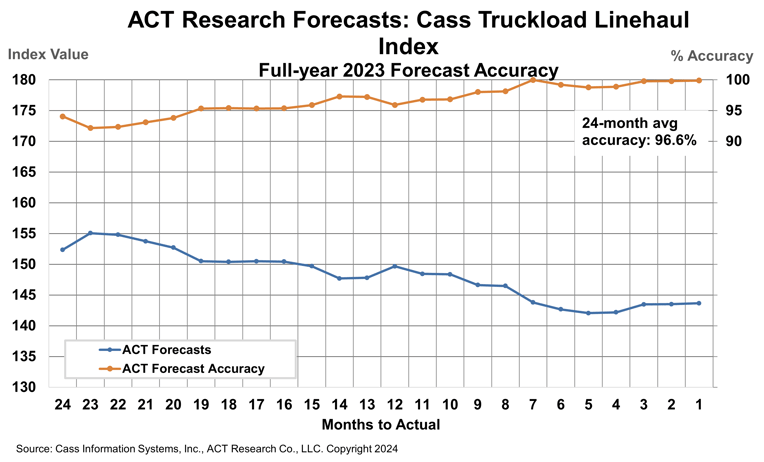
ACT Research’s 2023 forecasts for the Cass Truckload Linehaul Index were 96.6% accurate on average over the past 24 months, and 98.5% accurate over the past 12 months. The Cass Truckload Linehaul Index averaged 143.8 in 2023, precisely in line with our July 2023 estimate.
Release date: We strive to release our indexes on the 13th of each month. When this falls on a Friday or weekend, our goal is to publish on the next business day.

