Get the most up-to-date data and insights into shipping volumes and the cost of freight. See how they change each month and understand the market forces behind them.
| August 2021 | Year-over-year change | 2-year stacked change | Month-to-month change | Month-to-month change (SA) | |
| Cass Freight Index - Shipments | 1.234 | 12.3% | 3.7% | 4.8% | 5.0% |
| Cass Freight Index - Expenditures | 3.832 | 42.2% | 34.9% | 9.2% | 11.3% |
| Truckload Linehaul Index | 148.8 | 12.6% | 7.8% | 1.1% | NA |
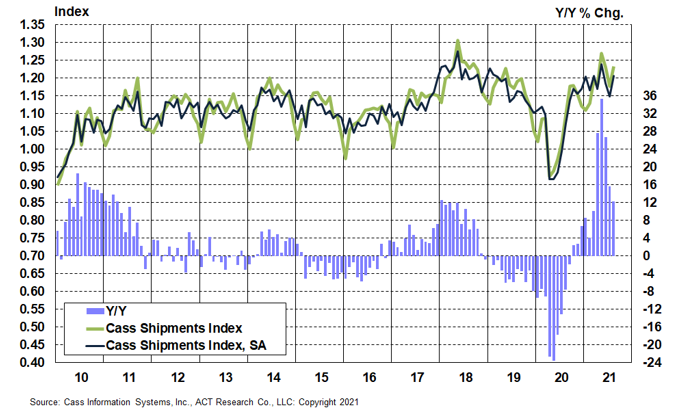
The shipments component of the Cass Freight Index® grew 12% y/y in August and should slow to mid-single-digit growth into year-end on tougher comps.
The recovery after a skid in June and July amid further slowdowns in rail volumes suggests trucking is picking up slack from the railroads, currently snarled by the chassis shortage.
But shipment volumes remain limited by the capacity of the freight network, as shown by the backlog of 125 or so containerships at anchor off North American ports. SoCal just hit a new record of 49. This containership backlog clearly represents a stronger and longer than average peak season demand outlook.
The extent to which constraints on equipment and driver supply ease in the coming months will largely dictate volumes, with declines likely to continue in intermodal and more pressure on trucking to shoulder the load.
Chart: Cass Shipments Index, January 2010 – August 2021 (01’1990=1.00)
See the methodology for the Cass Freight Index.
To access forecasts of the shipments component of the Cass Freight Index® and the Cass Truckload Linehaul Index® through 2023, subscribe to the ACT Research Freight Forecast report.
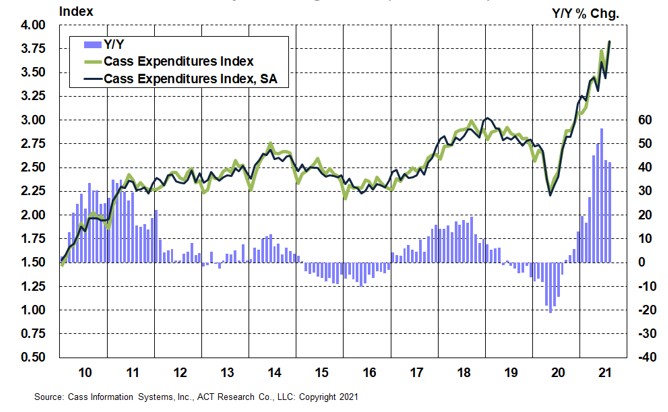
The expenditures component of the Cass Freight Index measures the total amount spent on freight. This index slowed a little more in August to 42% y/y growth from 43% in July. If normal seasonality were to play out for the rest of this year, the full-year increase in this index would be 35% in 2021, after a 7% decline in 2020 and no change in 2019.
Tougher comparisons in the coming months will naturally slow these y/y increases further, but extraordinary growth rates will continue in the near-term, driven by increases in both shipment volumes and freight rates.
Chart: Cass Expenditures Index, January 2010 – August 2021 (01’1990=1.00)
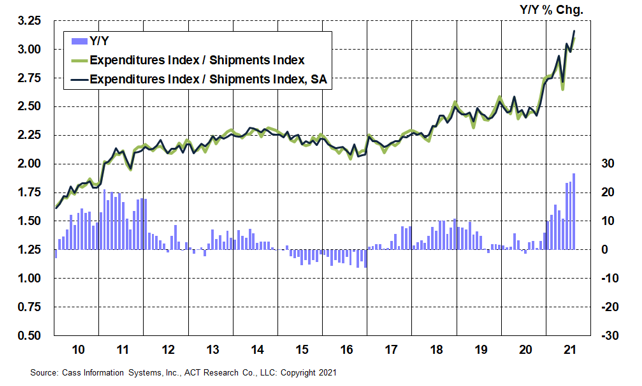
A simple calculation of the Cass Freight Index data (expenditures divided by shipments) produces a data set of inferred freight rates that explains the overall movement in rates.
The expenditures component of the Cass Freight Index measures the total amount spent on freight. This index slowed a little more in August to 42% y/y growth from 43% in July. If normal seasonality were to play out for the rest of this year, the full-year increase in this index would be 35% in 2021, after a 7% decline in 2020 and no change in 2019.
Tougher comparisons in the coming months will naturally slow these y/y increases further, but extraordinary growth rates will continue in the near-term, driven by increases in both shipment volumes and freight rates.
A good bit of the month-to-month movement in this data series can be attributable to modal mix shifts, but the average m/m increase over the past six months has been 2.5%, with a 15% total increase. For full-year 2021, if normal seasonality were to play out, this index would be up 20% from 2020.
Outside of mix shifts impacting the m/m data patterns, this data series shows broad and material increases in freight rates across modes. The data set is diversified among all modes, with truckload representing more than half of the dollars, followed by rail, LTL, parcel, and so on.
Chart: Cass Inferred Freight Rates, January 2010 – August 2021 (01’1990=1.00)
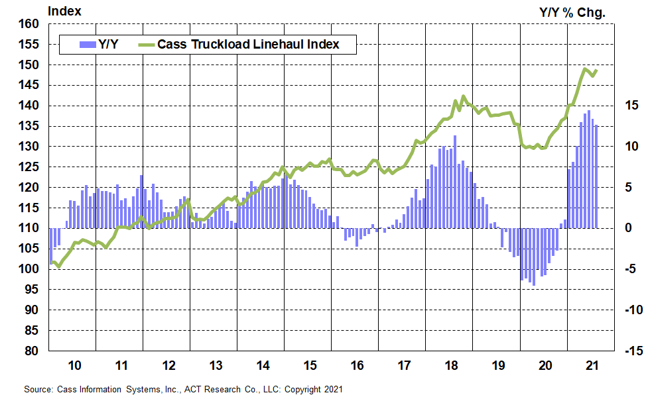
The Cass Truckload Linehaul Index® value of 148.8 in August rose 1.1% from July and 12.6% y/y, decelerating from a 13.4% y/y increase in July. This series has been under some pressure from longer-haul mix related to the chassis shortage and intermodal network congestion in recent months, so we would again caution shippers not to get too excited and carriers not to worry too much. This mix issue is noise, not signal, and the dampening effect on the index is considerable.
Even as easing shortages become more likely, the number of broken or strained links in the supply chain has risen recently, including likely inflationary effects from Hurricane/Tropical Storm Ida, the Delta variant worsening the chip shortage, and the chassis shortage. With a still-tight supply/demand balance, we would suggest the uptrend isn’t over yet.
Though equipment production is still limited by parts and labor shortages, capacity is beginning to return as drivers respond to higher pay, utilizing parked equipment until parts shortages ease. This will gradually change the trajectory of truckload rates, but it will take time.
Chart: Cass Truckload Linehaul Index®, January 2010 – August 2021 (01’1990=1.00)
See the methodology for the Cass Truckload Linehaul Index.
The length of haul in the data rose considerably again this month, about 20% y/y and 5% m/m, and as shown in the chart below, rates tend to fall on a per mile basis as mileage lengthens. The mix of these large carriers is not comparable to the Cass data, but it illustrates that longer mileage equals lower rates. So, we would argue that underlying truckload rates are up more in the 15%-20% range, more in line with the Cass Inferred Freight Rates and public carrier rate trends. This shift in freight patterns is more symptomatic of the congested rail network, leading to more transloading of longer-haul import shipments from the West Coast ports to the Midwest via truck.
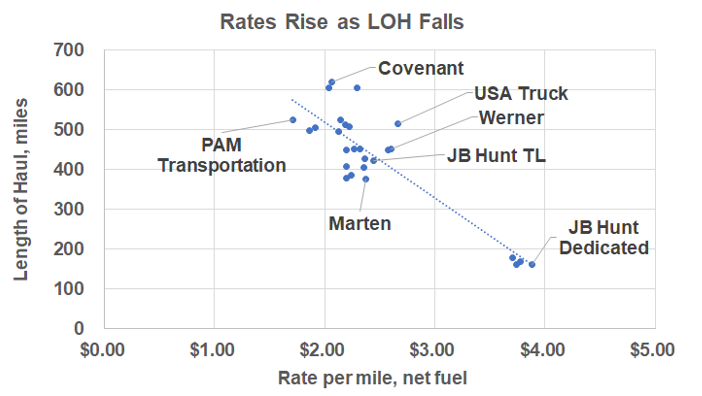
Source: ACT Research Publicly Traded For-Hire Truckload Carrier Database.
Class I railroad trends have had a rough few months, lagging seasonal trends due in large part to worsening chassis shortages. ACT Research expects chassis production to be significantly limited for some time, and the intermodal network is unlikely to be able to adjust to a large shortfall in chassis quickly. Though some sizable orders have been placed and manufacturers are on it, we’d roughly estimate it will take six to nine months before chassis production gets to the point where the shortage starts to ease. So, intermodal volumes are unlikely to bounce back quickly. Chassis production data and forecasts are available in this month’s Freight Forecast report.

Normal seasonality would suggest high-single-digit growth in rail volumes in Q3, down from the 23% y/y increase in Q2, but momentum slowed significantly over the past few months as network fluidity has suffered and chip and chassis shortages have worsened. Q3 may still end up with low-single-digit growth, but rail volumes may well decline y/y in Q4.
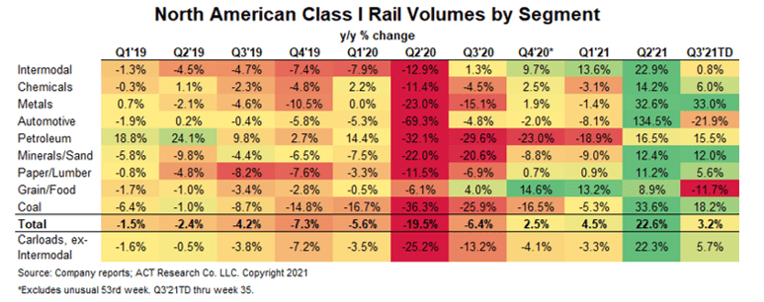
Trucking isn’t subject to the same capacity constraints, and the truck driver recovery, though gradual, is likely to help the trucking industry continue to pick up the slack in the coming months. Eventually this will help rebalance the market, but several recent factors, including Hurricane Ida, the Delta variant and the chip and chassis shortages have been inflationary for freight rates, extending the cycle at the margin.
Freight demand fundamentals remain strong, based on a strong U.S. consumer balance sheet, inventory restocking, and an industrial sector struggling to grow into record orders with infrastructure stimulus likely on the way.
But the dynamics of tight supply and exceptionally strong demand which have characterized the past year or so will not last indefinitely. The chip shortage continues to be a key fulcrum on which much in the world economy depends. As discussed in depth in ACT Research’s monthly report, there’s good reason to hope easing will start in Q4.
Release date: We strive to release our indexes on the 12th of each month. When this falls on a Friday or weekend, our goal is to publish on Monday.

Tim Denoyer joined ACT Research in 2017, after spending fifteen years in equity research focused primarily on the transportation, machinery and automotive industries. In addition to his roles analyzing commercial vehicle demand and alternative powertrain development (i.e. electrification), Tim is the lead analyst in ACT’s transportation research effort and the primary author of the ACT Freight Forecast, U.S. Rate and Volume Outlook. This report provides supply chain professionals with better visibility on the future of pricing and volume in trucking, the core of the $800 billion U.S. freight transportation industry, including truckload, less-than-truckload and intermodal/drayage.
This service leverages ACT’s expertise in the supply side economics of transportation and draws upon Tim’s background as an investment analyst. Tim was a co-founder of Wolfe Research, one of the leading equity research firms in the investment industry. While with Wolfe, Tim was recognized in Institutional Investor’s survey of investors as a Rising Star analyst in both the machinery and auto sectors. His investment experience also includes responsibility for covering the industrial sector of the equity markets, most prominently with leading hedge fund Balyasny Asset Management.
The material contained herein is intended as general industry commentary. The Cass Freight Index, Cass Truckload Linehaul Index (“Indexes”), and other content are based upon information that we consider reliable, but Cass does not guarantee the accuracy, timeliness, reliability, continued availability or completeness of any information or underlying assumptions, and Cass shall have no liability for any errors, omissions or interruptions. Any data on past performance contained in the Indexes is no guarantee as to future performance. The Indexes and other content are not intended to predict actual results, and no assurances are given with respect thereto. Cass makes no warranty, express or implied. Opinions expressed herein as to the Indexes are those of Stifel and may differ from those of Cass Information Systems Inc. All opinions and estimates are given as of the date hereof and are subject to change.
© Copyright 2023 Cass Information Systems, Inc.