Get the most up-to-date data and insights into shipping volumes and the cost of freight. See how they change each month and understand the market forces behind them.
| June 2021 | Year-over-year change | 2-year stacked change | Month-to-month change | Month-to-month change (SA) | |
| Cass Freight Index - Shipments | 1.231 | 26.8% | 4.2% | -3.0% | -4.2% |
| Cass Freight Index - Expenditures | 3.732 | 56.4% | 27.9% | 11.0% | 9.4% |
| Truckload Linehaul Index | 148.40 | 14.5% | 7.7% | -0.4% | NA |
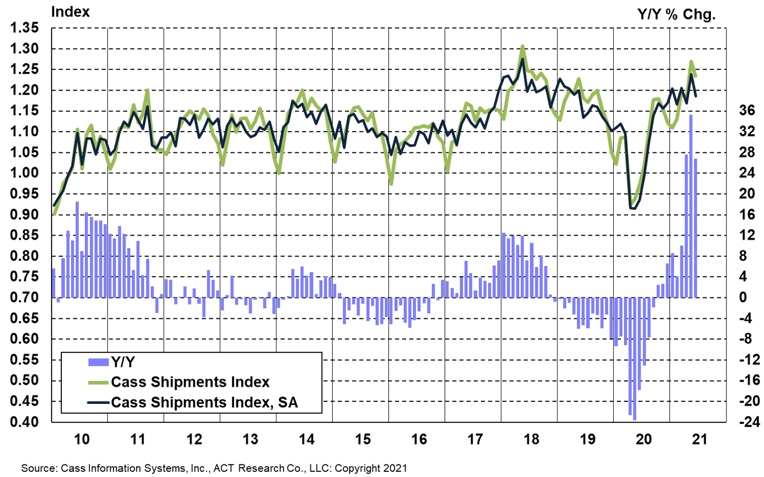
The shipments component of the Cass Freight Index grew 26.8% y/y in June, decelerated from the record 35.3% y/y increase in May. On a seasonally adjusted (SA) basis, the shipments index declined by 4.2% m/m in June, after a 5.9% m/m surge in May.
While still among the top ten results in the past decade, the result indicates a little slower volume environment than May, which is consistent with several other broad freight measures, including rail volumes and spot truckloads. Fading Federal stimulus was likely a contributor, but our industry discussions suggest shipment volumes continue to be hindered by supply constraints, which range from driver and trailer shortages in TL and LTL to chassis shortages hampering intermodal capacity.
The Cass shipments index remained positive on a two-year stacked basis for the second straight month, 4.2% above June 2019, after a 3.3% year-over-two-year increase in May.
Chart: Cass Shipments Index, January 2009 – June 2021 (01’1990=1.00)

See the methodology for the Cass Freight Index.
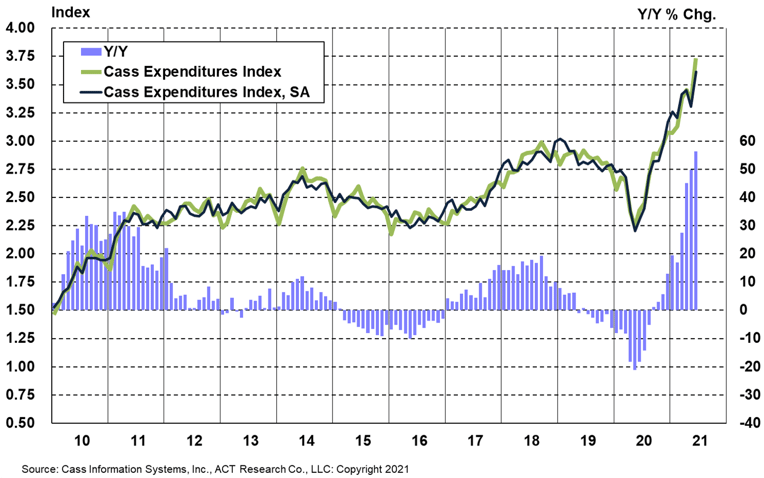
The expenditures portion of the Cass Freight Index grew at its fastest pace ever on a y/y basis again in June, up 56.4% y/y, accelerated from 49.9% y/y growth in May. This acceleration occurred even against a slightly tougher comparison, as higher rate trends outweighed the slower shipment volumes.
Tougher comparisons in the coming months will naturally slow these y/y increases, but extraordinary growth rates will continue in the near term, driven by increases in both shipment volumes and freight rates.
On a seasonally adjusted basis, the Cass expenditures index rose 9.4% from May, and with volumes softer m/m, the decline was more than explained by higher embedded rates, which jumped 12.3% m/m.
Chart: Cass Expenditures Index, January 2009 – June 2021 (01’1990=1.00)

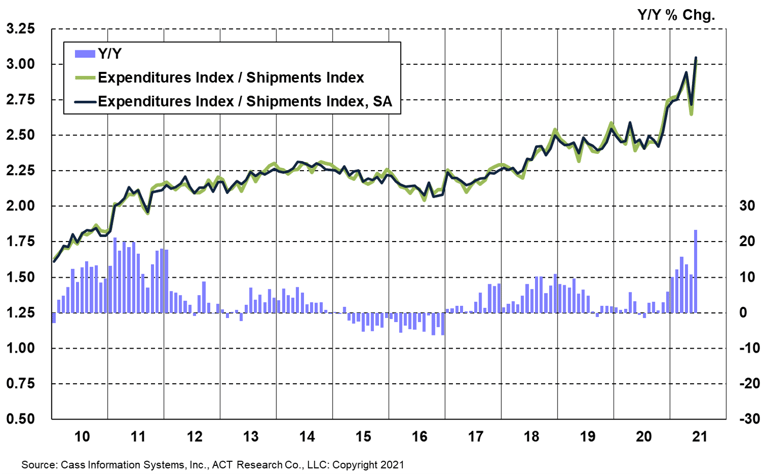
A simple calculation of the Cass Freight Index data (expenditures divided by shipments) produces a data set of “implied freight rates” that explains the overall movement in rates.
This result confirms that the accelerating trend remained intact through Q2, but the volatility in May and June was partly due to modal mix. The proportion of smaller/lower-cost LTL shipments in the data set rose in May, then returned to a more normal level in June, and this mix shift pressed total embedded rates higher in June just as it pressed the series lower in May (the “wash out” noted as likely in last month’s report).
Outside of mix shifts impacting the m/m data patterns, this data series shows broad and material increases in freight rates across modes. This data series is diversified among all modes, with truckload representing more than half of the dollars, followed by rail, LTL, parcel, and so on.
Chart: Cass Implied Freight Rates, January 2009 – June 2021 (01’1990=1.00)

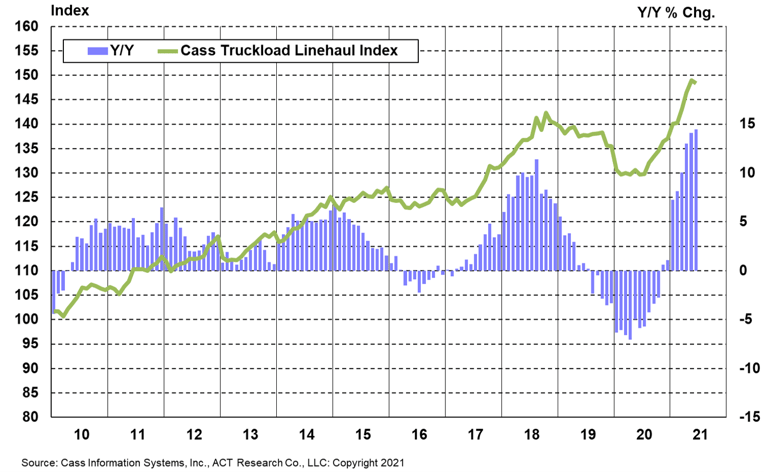
The Cass Truckload Linehaul Index® value of 148.4 in June fell slightly from 149.0 in May and accelerated to a 14.5% y/y increase from 14.1% in May. On a m/m basis, the seasonally adjusted index was 0.4% lower than May, after eleven straight increases.
A longer average length of haul appears responsible for the decline from May, rather than any softness in rate trends, as rates tend to fall on a per mile basis as mileage lengthens. Interestingly, this downtick is more symptomatic of the rail network stretched to capacity, which is resulting in more transloading of import shipments from the west coast to the Midwest via truck than normal.
The trend of the Cass Truckload Linehaul Index® should continue to move higher in the near-term, driven by robust demand and tight supply. But although truck, trailer and chassis production are still limited by parts shortages, capacity is beginning to accelerate as drivers respond to higher pay and parts constraints begin to ease, which will change the trajectory of truckload rates.
The ACT Freight Forecast now forecasts the Cass Truckload Linehaul Index® through 2023.
Chart: Cass Truckload Linehaul Index®, January 2009 – June 2021 (01’1990=1.00)

See the methodology for the Cass Truckload Linehaul Index.
In June, Class I railroad trends slowed a bit more than tougher prior year comparisons, due in part to chassis shortages. But although automotive volumes turned negative y/y in recent weeks, they rose another 4% m/m in June after gaining 4% in May as parts shortages eased, beginning to recover from the 20% m/m decline in April.
In Q2, rail volumes were slightly above sequential seasonal patterns, up 23% y/y, but momentum slowed in recent weeks. Against a y/y decline of 6% in Q3’20, prior year comparisons will be more meaningful in the coming months, and this broad measure of freight volumes is still on pace for high-single-digit y/y growth in Q3.

Even with material supply constraints, the freight cycle remains in high-growth mode, benefiting from a strong retail economy, tight inventories, and a persistent backlog of containerships anchored in the San Pedro Bay. In addition, while the industrial sector continues to struggle on a relative basis, with record capital goods demand and likely infrastructure programs, an accelerating U.S. industrial sector should support freight growth for some time.
But the dynamics of tight supply and exceptionally strong demand, which have characterized the past year or so will not last indefinitely, and several of the indicators we monitor are auguring new trajectories.
For example, the 24,500 jobs added to the truck transportation employment payrolls in June, per the Bureau of Labor Statistics, were more than in the past ten months combined. This also coincided with the curtailment of extended unemployment in several states important to the trucking industry. As we like to say, the cure for high prices is high prices.

Tim Denoyer joined ACT Research in 2017, after spending fifteen years in equity research focused primarily on the transportation, machinery and automotive industries. In addition to his roles analyzing commercial vehicle demand and alternative powertrain development (i.e. electrification), Tim is the lead analyst in ACT’s transportation research effort and the primary author of the ACT Freight Forecast, U.S. Rate and Volume Outlook. This report provides supply chain professionals with better visibility on the future of pricing and volume in trucking, the core of the $800 billion U.S. freight transportation industry, including truckload, less-than-truckload and intermodal/drayage.
This service leverages ACT’s expertise in the supply side economics of transportation and draws upon Tim’s background as an investment analyst. Tim was a co-founder of Wolfe Research, one of the leading equity research firms in the investment industry. While with Wolfe, Tim was recognized in Institutional Investor’s survey of investors as a Rising Star analyst in both the machinery and auto sectors. His investment experience also includes responsibility for covering the industrial sector of the equity markets, most prominently with leading hedge fund Balyasny Asset Management.
The material contained herein is intended as general industry commentary. The Cass Freight Index, Cass Truckload Linehaul Index (“Indexes”), and other content are based upon information that we consider reliable, but Cass does not guarantee the accuracy, timeliness, reliability, continued availability or completeness of any information or underlying assumptions, and Cass shall have no liability for any errors, omissions or interruptions. Any data on past performance contained in the Indexes is no guarantee as to future performance. The Indexes and other content are not intended to predict actual results, and no assurances are given with respect thereto. Cass makes no warranty, express or implied. Opinions expressed herein as to the Indexes are those of Stifel and may differ from those of Cass Information Systems Inc. All opinions and estimates are given as of the date hereof and are subject to change.
© Copyright 2023 Cass Information Systems, Inc.