Cass Transportation Index Report September 2024

Get the most up-to-date data and insights into shipping volumes and the cost of freight. See how they change each month and understand the market forces behind them.

SubscribeDownload Historical Data Points (xls)

Signs of Price Stabilization 

  September 2024 Year-over-year change 2-year stacked change Month-to-month change Month-to-month change (SA*)
Cass Freight Index - Shipments 1.102 -5.2% -11.2% -1.7% -3.2%
Cass Freight Index - Expenditures 3.224 -6.6% -30.3% 2.4% 0.4%
Cass Inferred Freight Rates 2.926 -1.4% NA 4.2% 3.7%
Truckload Linehaul Index 137.10 -3.4% -12.3% 0.3% NA


* SA = seasonally adjusted

Cass Freight Index® - Shipments

The shipments component of the Cass Freight Index fell 1.7% m/m in September, after a 1.0% increase in August.

  • The index fell 2.6% m/m in SA terms from August to September.
  • Shipments declined by 5.2% y/y in September after a 1.9% y/y drop in August.

In a sign that private fleet insourcing still isn’t finished, the decline comes as Class 8 tractor sales jumped in Q3 after supply constraints in Q2.

After rising 13% in 2021 and 0.6% in 2022, the index declined 5.5% in 2023. With normal seasonality, the index will fall about 3% y/y in October and 4%-5% in 2024.


Cass Freight Index-Shipments-September-2024


See the Methodology for the Cass Freight Index


Cass Freight Index - Expenditures

The expenditures component of the Cass Freight Index, which measures the total amount spent on freight, rose 2.4% m/m in September despite another decline in fuel prices. The y/y decline in expenditures moderated to 6.6% from 9.0% in August.

With shipments down 1.7% m/m, we infer the 2.4% increase in expenditures included rates up 4.2% m/m in August (see our inferred rates data series below).

  • In SA terms, the expenditures index rose 1.0% m/m, with shipments down 2.6% and rates up 3.7%.  

This index includes changes in fuel, modal mix, intramodal mix, and accessorial charges, so is a bit more volatile than the cleaner Cass Truckload Linehaul Index®.

The expenditures component of the Cass Freight Index fell 19% in 2023, after a record 38% surge in 2021 and another 23% increase in 2022. It declined another 16% in 1H’24, and assuming normal seasonal patterns from here, will decline 11%-12% this year.


Cass Freight Index-Expenditures-September-2024


Inferred Freight Rates

The rates embedded in the two components of the Cass Freight Index declined 1.4% y/y in September, after a 7.2% y/y drop in August.

  • On a m/m basis, Cass Inferred Freight Rates rose 4.2% m/m in September (3.7% SA), bouncing from a cycle low, mainly due to changing mode mix, as fuel continued to exert downward pressure.
  • Based on the normal seasonal pattern, this index will still fall about 2% y/y in October.
  • The normal seasonal pattern from here would leave inferred rates down 7% in 2024, after a 14% drop in 2023.


Cass Inferred Freight Rates-September-2024


Cass Inferred Freight Rates are a simple calculation of the Cass Freight Index data—expenditures divided by shipments—producing a data set that explains the overall movement in cost per shipment. The data set is diversified among all modes, with truckload (TL) representing more than half of the dollars, followed by less-than-truckload (LTL), rail, parcel, and so on.


Download the Data

Truckload Linehaul Index

The Cass Truckload Linehaul Index—a measure of the movement in linehaul rates—rose 0.3% m/m in September, the first increase after four straight monthly declines. 

  • The y/y decline of 3.5% widened slightly from 3.3% in August. While this has narrowed from a 15% y/y decline a year ago, it seems unlikely to turn positive until early 2025.
  • As a broad truckload market indicator, this index includes both spot and contract freight. Spot rates have started to increase, but although we’ve heard of isolated instances of contract rate increases, contract bids remain very competitive.


Cass Truckload Linehaul Index-September-2024


See the Methodology for the Cass Truckload Linehaul Index


Freight Expectations

The key theme we’ve been highlighting for more than a year now is the insourcing of freight from the for-hire market to private fleets, which has perhaps been the defining feature extending the soft freight cycle in an economy that has surpassed expectations. The resilience of owner-operators is of course an important part of the story, but operating authority revocations continue apace.  

Lower equipment supply, particularly by private fleets, may play a key role in a market turn in 2025, in our view. And next month, an FMCSA regulation could potentially downgrade tens of thousands of CDL holders in states who have not heretofore been required to enforce the FMCSA’s Drug & Alcohol Clearinghouse.

This is a tough one to quantify. Our industry contacts suggest there is definitely some number of drivers in violation on the road. Not at the large, high-quality fleets, but it’s happening. See a recent Q&A here. When state driver’s license authorities downgrade a large number of CDLs on November 18th, it should have two measurable effects: making our roads safer, and leading truckload rates higher. 

Our outlook through 2026 is detailed in the ACT Research Freight Forecast. This service provides in-depth analysis and forecasts for a broad range of U.S. freight measures, including the Cass Freight Index, Cass Truckload Linehaul Index, DAT spot and contract rates by trailer type, LTL, and intermodal price indexes. We provide monthly, quarterly, and annual predictions for over forty data series over a two- to three-year time horizon, including capacity, volumes, and rates. The ACT Research Freight Forecast is released monthly in conjunction with the Cass Transportation Index report.

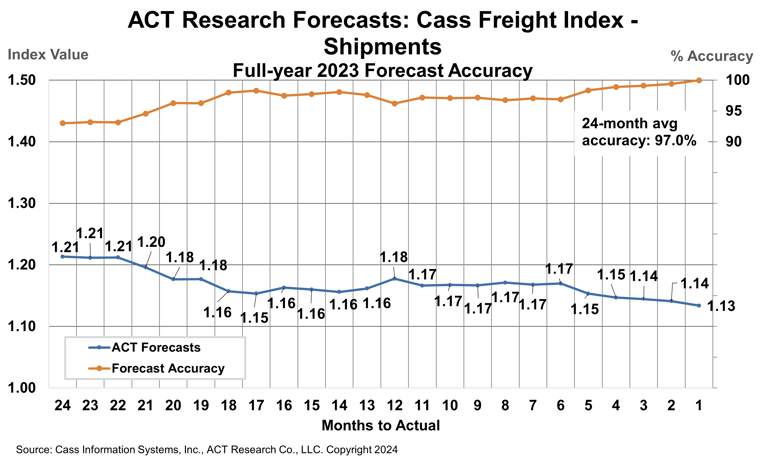
How have ACT Research’s freight forecasts performed? For 2023, ACT’s forecasts for the shipments component of the Cass Freight Index were 96.9% accurate on average for the 24-month forecast period. 

(As a reminder, ACT Research’s Tim Denoyer writes this report.)


ACT Forecast Accuracy 2023 Shipments


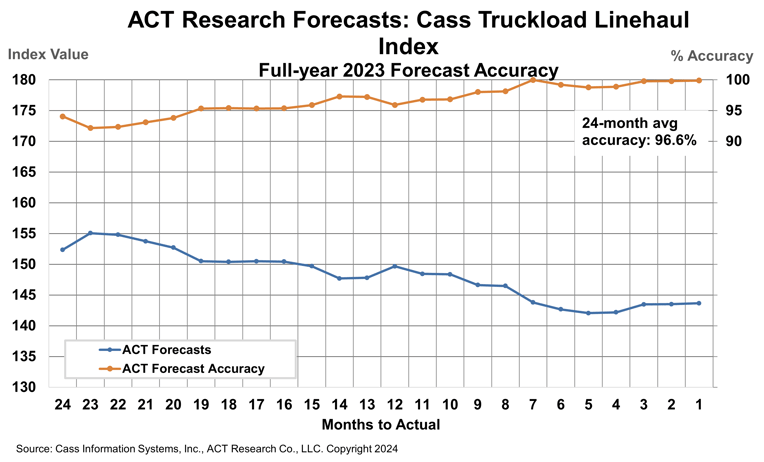
ACT Research’s 2023 forecasts for the Cass Truckload Linehaul Index were 96.6% accurate on average over the past 24 months, and 98.5% accurate over the past 12 months. The Cass Truckload Linehaul Index averaged 143.8 in 2023, precisely in line with our July 2023 estimate. 


ACT Forecast Accuracy 2023 Cass TL LH Index


Release date: We strive to release our indexes on the 13th of each month. When this falls on a Friday or weekend, our goal is to publish on the next business day.

Tim Denoyer head

About the Author: Tim Denoyer, ACT Research

Tim Denoyer joined ACT Research in 2017 after spending fifteen years in equity research focused primarily on the transportation, machinery, and automotive industries. Tim is a senior analyst leading ACT’s transportation research effort and the primary author of the ACT Freight Forecast, U.S. Rate and Volume OUTLOOK. Research associate, Carter Vieth, who joined ACT in early 2020 after graduating from Indiana University, also contributes to the report. This report provides supply-chain professionals with better visibility on the future of pricing and volume in trucking, the core of the $1.2 trillion US freight transportation industry, including TL, LTL, and intermodal. 

Tim also contributes to ACT’s core Classes 4-8 commercial vehicle (CV) data analysis and forecasting; powertrain development, such as electrification analysis; and used truck valuation and forecasting. Tim has supported or led numerous project-based market studies on behalf of clients in his six years with ACT on topics ranging from upcoming emissions and environmental regulations to alternative powertrain cost analyses, to e-commerce and last-mile logistics, to autonomous freight market sizing.  

ACT’s freight research service leverages its expertise in the supply-side economics of transportation and draws upon Tim’s background as an investment analyst, beginning at Prudential and Bear Stearns. Tim was a co-founder of Wolfe Research, one of the leading equity research firms in the investment industry. His experience also includes responsibility for covering the industrial sector of the global equity markets, including with leading investment management company Balyasny Asset Management.

Disclaimer

The material contained herein is intended as general industry commentary. The Cass Freight Index, Cass Truckload Linehaul Index (“Indexes”), and other content are based upon information that we consider reliable, but Cass does not guarantee the accuracy, timeliness, reliability, continued availability or completeness of any information or underlying assumptions, and Cass shall have no liability for any errors, omissions or interruptions. Any data on past performance contained in the Indexes is no guarantee as to future performance. The Indexes and other content are not intended to predict actual results, and no assurances are given with respect thereto. Cass makes no warranty, express or implied. Opinions expressed herein as to the Indexes are those of ACT Research and may differ from those of Cass Information Systems Inc. All opinions and estimates are given as of the date hereof and are subject to change.

Receive Index updates straight to your inbox